ΑΙhub.org
Counterfactual explanations for land cover mapping: interview with Cassio Dantas

In their paper Counterfactual Explanations for Land Cover Mapping in a Multi-class Setting, Cassio Dantas, Diego Marcos and Dino Ienco apply counterfactual explanations to remote sensing time series data for land-cover mapping classification. In this interview, Cassio tells us more about explainable AI and counterfactuals, the team’s research methodology, and their main findings.
What is the topic of the research in your paper?
Our paper falls into the growing topic of explainable artificial intelligence (XAI). Despite the performances achieved by recent deep learning approaches, they remain black-box models with limited understanding of their internal behavior. To improve general acceptability and trustworthiness of such models, there is a growing need to improve their interpretability and make their decision-making processes more transparent. More precisely, to make the black box more grey.
In this research work we explore a particular type of technique called counterfactual explanations, which aims to describe the behavior of a model by providing minimal changes to the input data that would result in realistic samples belonging to a different class.
Concerning the domain of application, we focus on remote sensing time series data in the context of a land-cover mapping classification. Of particular importance, this task provides crucial information for making informed policy, development, planning, and resource management decisions.
Could you tell us about the implications of your research and why it is an interesting area for study?
The proposed approach contributes to raising the interpretability of current deep learning techniques. This line of research becomes increasingly important as deep learning models become widespread. In the remote sensing field, for instance, such models have shown impressive results on a variety of tasks such as image super-resolution, image restoration, biophysical variable estimation and land cover classification from satellite image time series (SITS) data. For such strategic applications, it is essential that a model’s prediction comes accompanied with human-interpretable explanations that will help improve reliability on the model’s decisions as well as helping understanding its weaknesses and limitations.
Counterfactual explanations are a powerful tool in this context, as they help characterize a model’s decision boundary, as well as providing actionable guidelines on how to modify a given prediction with minimal effort, which might be quite useful in several application cases.
However, providing valuable counterfactual explanations is not trivial in practice, as they should ideally fulfil several criteria, such as: 1) proximity, i.e. being as close as possible to the input data sample. 2) plausibility, i.e. resembling some real data that could actually occur in practice; 3) sparsity, i.e. promoting changes to a few features only, in order to be more amenable to action. In the case of time series, for instance, it is highly desirable for the counterfactual explanation to perturb only short and contiguous segments of the timeline in order to make the interpretation easier for the domain expert.
It can be challenging to provide an automatic counterfactual generation approach that fulfils all the above-mentioned requirements. For this reason, it remains an active research area nowadays. Our proposed approach is a new attempt to efficiently address such technical challenges.
Could you explain your methodology?
We propose a counterfactual generation approach in a multi-class land cover classification setting for satellite image time series data. The proposed approach generates counterfactual explanations that are plausible (i.e. belong as much as possible to the data distribution) and close to the original data (modifying only a limited and contiguous set of time entries by a small amount).
Another distinctive feature of the proposed approach (compared to other existing counterfactual explanation approaches for time series data) is the lack of prior assumption on the targeted class for a given counterfactual explanation. This inherent flexibility allows for the discovery of interesting information on the relationship between land cover classes.
To ensure the plausibility of the generated explanations, we rely on a GAN (generative adversarial network)-inspired architecture which is shown in Fig.1.
 Fig.1: Schematic representation of the proposed approach.
Given a pre-trained Classifier, a counterfactual explanation is obtained for each input time series by adding a perturbation to the original signal. Such perturbation is generated by the Noiser module, a simple multilayer perceptron with two hidden layers, which is learned with the goal to swap the prediction of the Classifier. Finally, we include a Discriminator module which is trained to identify unrealistic counterfactuals in a two-player game against the Noiser module that acts as a the generator in this adversarial training scheme. Finally, to keep perturbations concentrated in a small and contiguous time frame we employ a weighted L1-norm penalization.
What were your main findings?
We applied the proposed technique to NDVI (Normalized Differential Vegetation Index) time series derived from Sentinel-2 satellite images spanning over the year 2020 and covering a 2338 km2 area around the town of Koumbia, in the south-west of Burkina Faso. The input data is composed of eight land cover classes, including three crop-types (cereals, cotton, oleaginous), three vegetation types (grassland, shrubland, forest), bare soil and water.
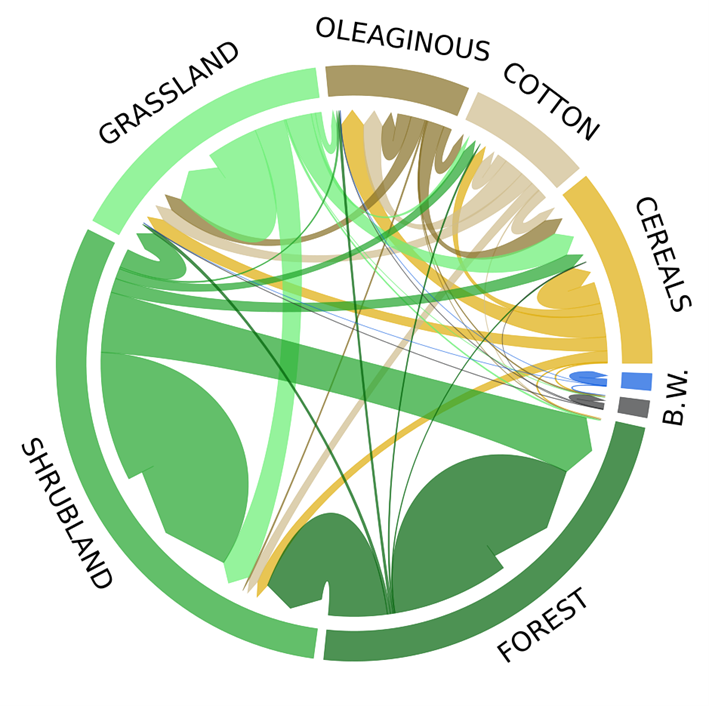
Because the proposed approach does not predefine a target class for the generated counterfactuals, it allows input samples from a certain class to freely split-up into multiple target classes. Class transitions obtained in such a way (see Fig. 2) as to bring up valuable insights on the relation between classes.
For instance, in Fig. 2, the three crop-related classes (cereals, cotton and oleaginous) form a very coherent cluster, with almost all transitions staying within the sub-group. The vegetation classes shrubland and forest are most often sent to one another, while grassland remains much closer to the crop classes (oleaginous). The bare soil class is also most often transformed into oleaginous. Finally, the water class is very rarely modified by the counterfactual learning process, which is somewhat expected due to its very distinct characteristic (NDVI signature) compared to the other classes.
 Fig. 2: Class transitions induced by the counterfactuals (B. stands for bare soil and W. for water).
Two illustrative examples of counterfactual explanations are shown in Fig. 3. It is interesting to note the similarity between the generated counterfactual and a real data sample from the same class (on the neighboring plot). To transform a shrubland sample into forest, NDVI is added between the months of July and October. The opposite is done to obtain the reverse transition, which matches the general knowledge of such land cover classes on the considered study area.
 Fig. 3: Examples of real time series with corresponding counterfactual from classes shrubland and forest.
To quantify to what extent the proposed counterfactual explanations fit the original data distribution, we ran an anomaly detection algorithm on the generated explanations. An impressive rate of 88.9% of the generated counterfactuals were identified as inliers, compared to only 72.6% for a non-adversarial variant of the proposed network. The obtained results clearly show that counterfactual plausibility is achieved thanks to the adversarial training process.
Finally, we also verified that the proposed weighted L1-norm regularization successfully enforces sparsity of the counterfactual explanations besides controlling its proximity with the input data sample.
What further work are you planning in this area?
The emerging topic of counterfactual explanations still offers exciting research avenues to be explored. Especially when it comes to less conventional types of data (compare to images), since the early developments in this area mostly emanated from the computer vision community. When it comes to time series data, for instance, much work remains to be done, even more so for remote sensing time series data.
As a possible future work, it would be interesting to extend our proposed framework to the case of multivariate time series data and evaluate the methodology on other applications coming from different domains in which time series data are prominent. Another exciting research direction would be to leverage the feedback provided by the generated counterfactual samples regarding the most frequent class confusions to improve the robustness of the classifier itself.
About Cassio F. Dantas

|
Cassio F. Dantas is a research scientist at INRAE, TETIS, Montpellier, France. Between 2020 and 2022, he was a postdoctoral researcher at IRIT (computer science laboratory of Toulouse) and IMAG (mathematics laboratory of the University of Montpellier). He performed his PhD studies at Inria in Rennes, France, and received his degree on signal, image and vision in 2019. His current research interests include interpretable artificial intelligence, optimization algorithms and machine learning for remote sensing data with applications to agriculture, ecosystems and environment. |


